MEMS微振镜MEMS Micromirror
Comprehensive characterization of mode shapes
Micromirror topography is recorded along the MEMS excitation period for each mode shape of its resonant frequency. This full-field measurement allow the MEMS designer to characterize micromirrors’:
- Displacement amplitude, speed, acceleration, etc.
- Scanning angles
- Dynamic surface deformation
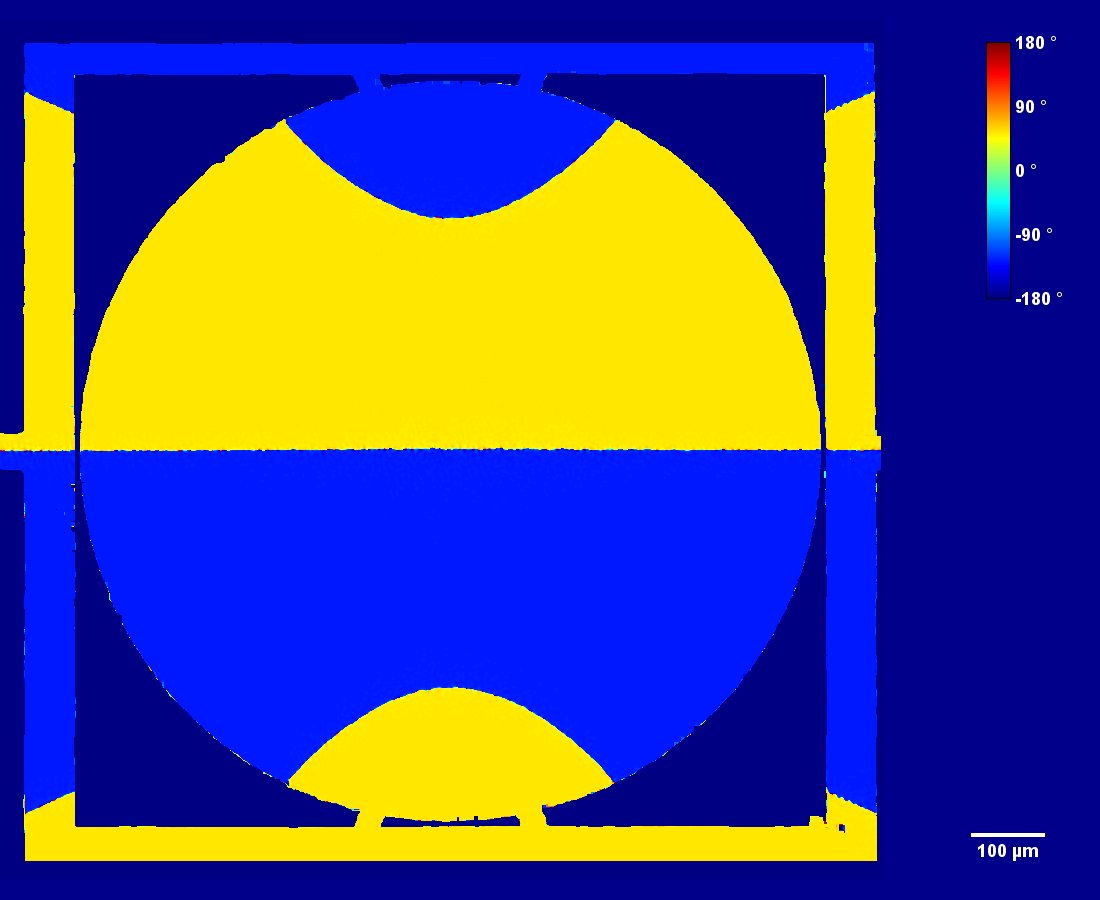
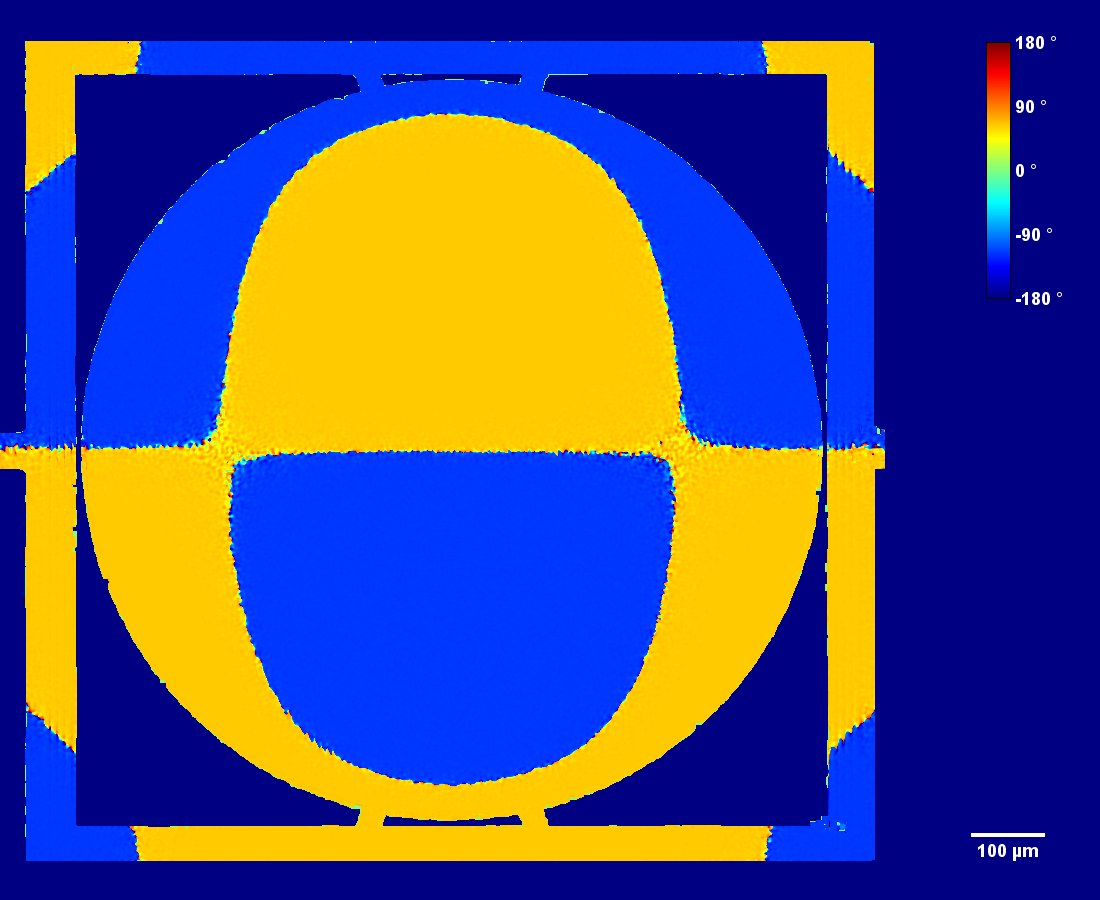
- Mode shapes (Vibration amplitude maps and phase maps)
Dynamic Deformation and Optical Aberration of Micromirrors
Full deflection range automated workflow
An automated solution for measuring the dynamic deformation of micromirror surface over its entire deflection range at its resonance frequency was recently reported by our DHM users at Silicon Austria Labs GmbH, who is also the WINNER of Lyncée Tec Challenge 2022!
A motorized goniometer is integrated into the DHM® sample holder to control the microdevice tilt and tip. Using the stroboscopic module, the data acquisition, the mirror deflection angle, and the goniometer angles are synchronized. For any deflection angle, the mirror’s reflective surface is measured when it is positioned perpendicular to the DHM®’s optical axis. It enables precise quantification of dynamic deformation over its entire deflection range.
Your simulations can be efficiently validated against experiment data to improve your MEMS design.
The fully automated workflow has four main steps described in the sections here below.
Description:
- Courtesy of : Silicon Austria Labs GmbG, Austria
- Device: Dual axis micromirror
- Instrument: DHM® R-2100
- Magnification: 2.5x
Publication:
Measuring angle-resolved dynamic deformation of micromirrors with digital stroboscopic holography
Pooja Thakkar, Clément Fleury, Markus Bainschab, Takashi Sasaki, Markus Zauner, Dominik Holzmann, Adrien Piot, and Jaka Pribošek in SPIE Photonics Europe 2022
A Comprehensive Characterization Procedure for Resonant MEMS Scanning Mirrors
Clement Fleury, Markus Bainschab,Gianluca Mendicino,Roberto Carminati,Pooja Thakkar,Dominik Holzmann,Sara Guerreiro and Adrien Piot (Silicon Austria Labs GmbH and STMicroelectronics) in XXXV EUROSENSORS Conference, Lecce, Italy, 10–13 September 2023
1. Determination of the resonance frequency
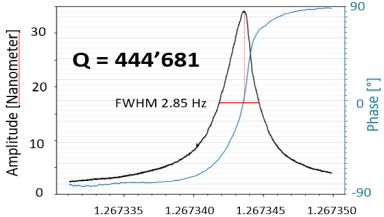
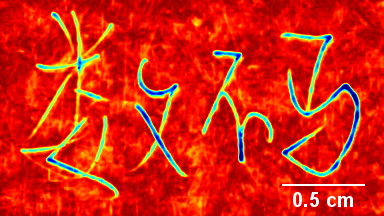
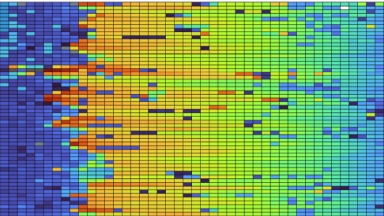
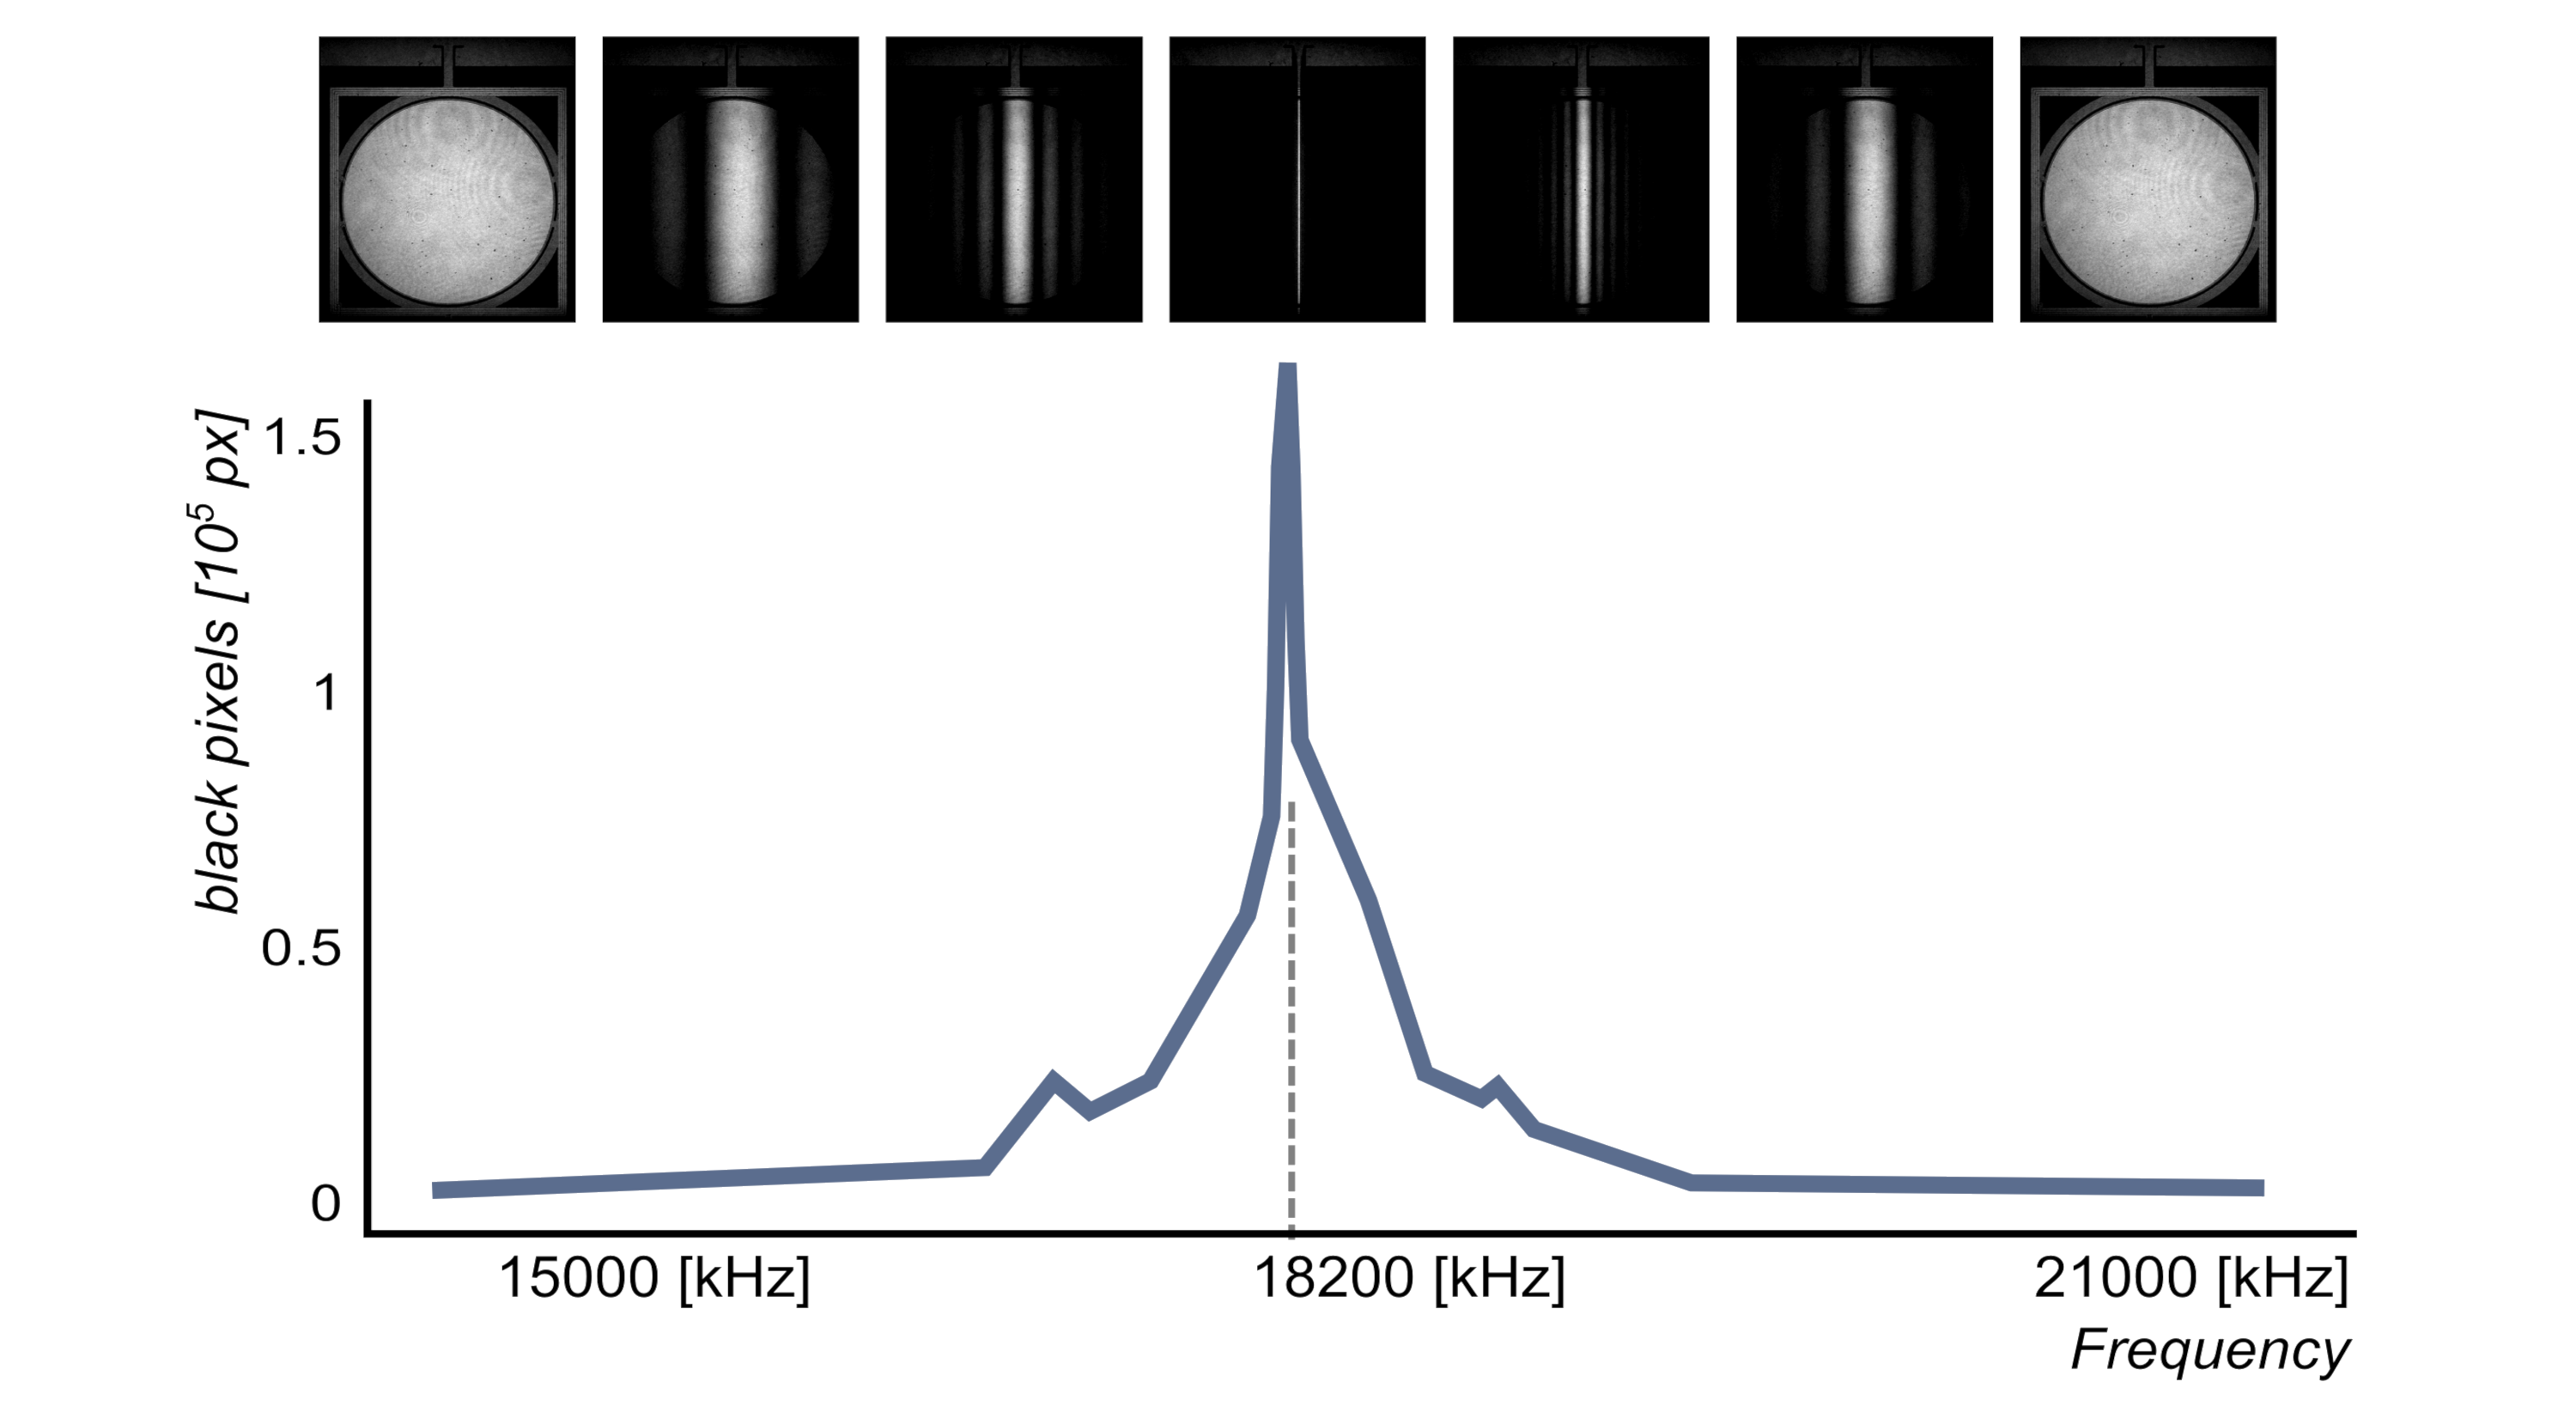
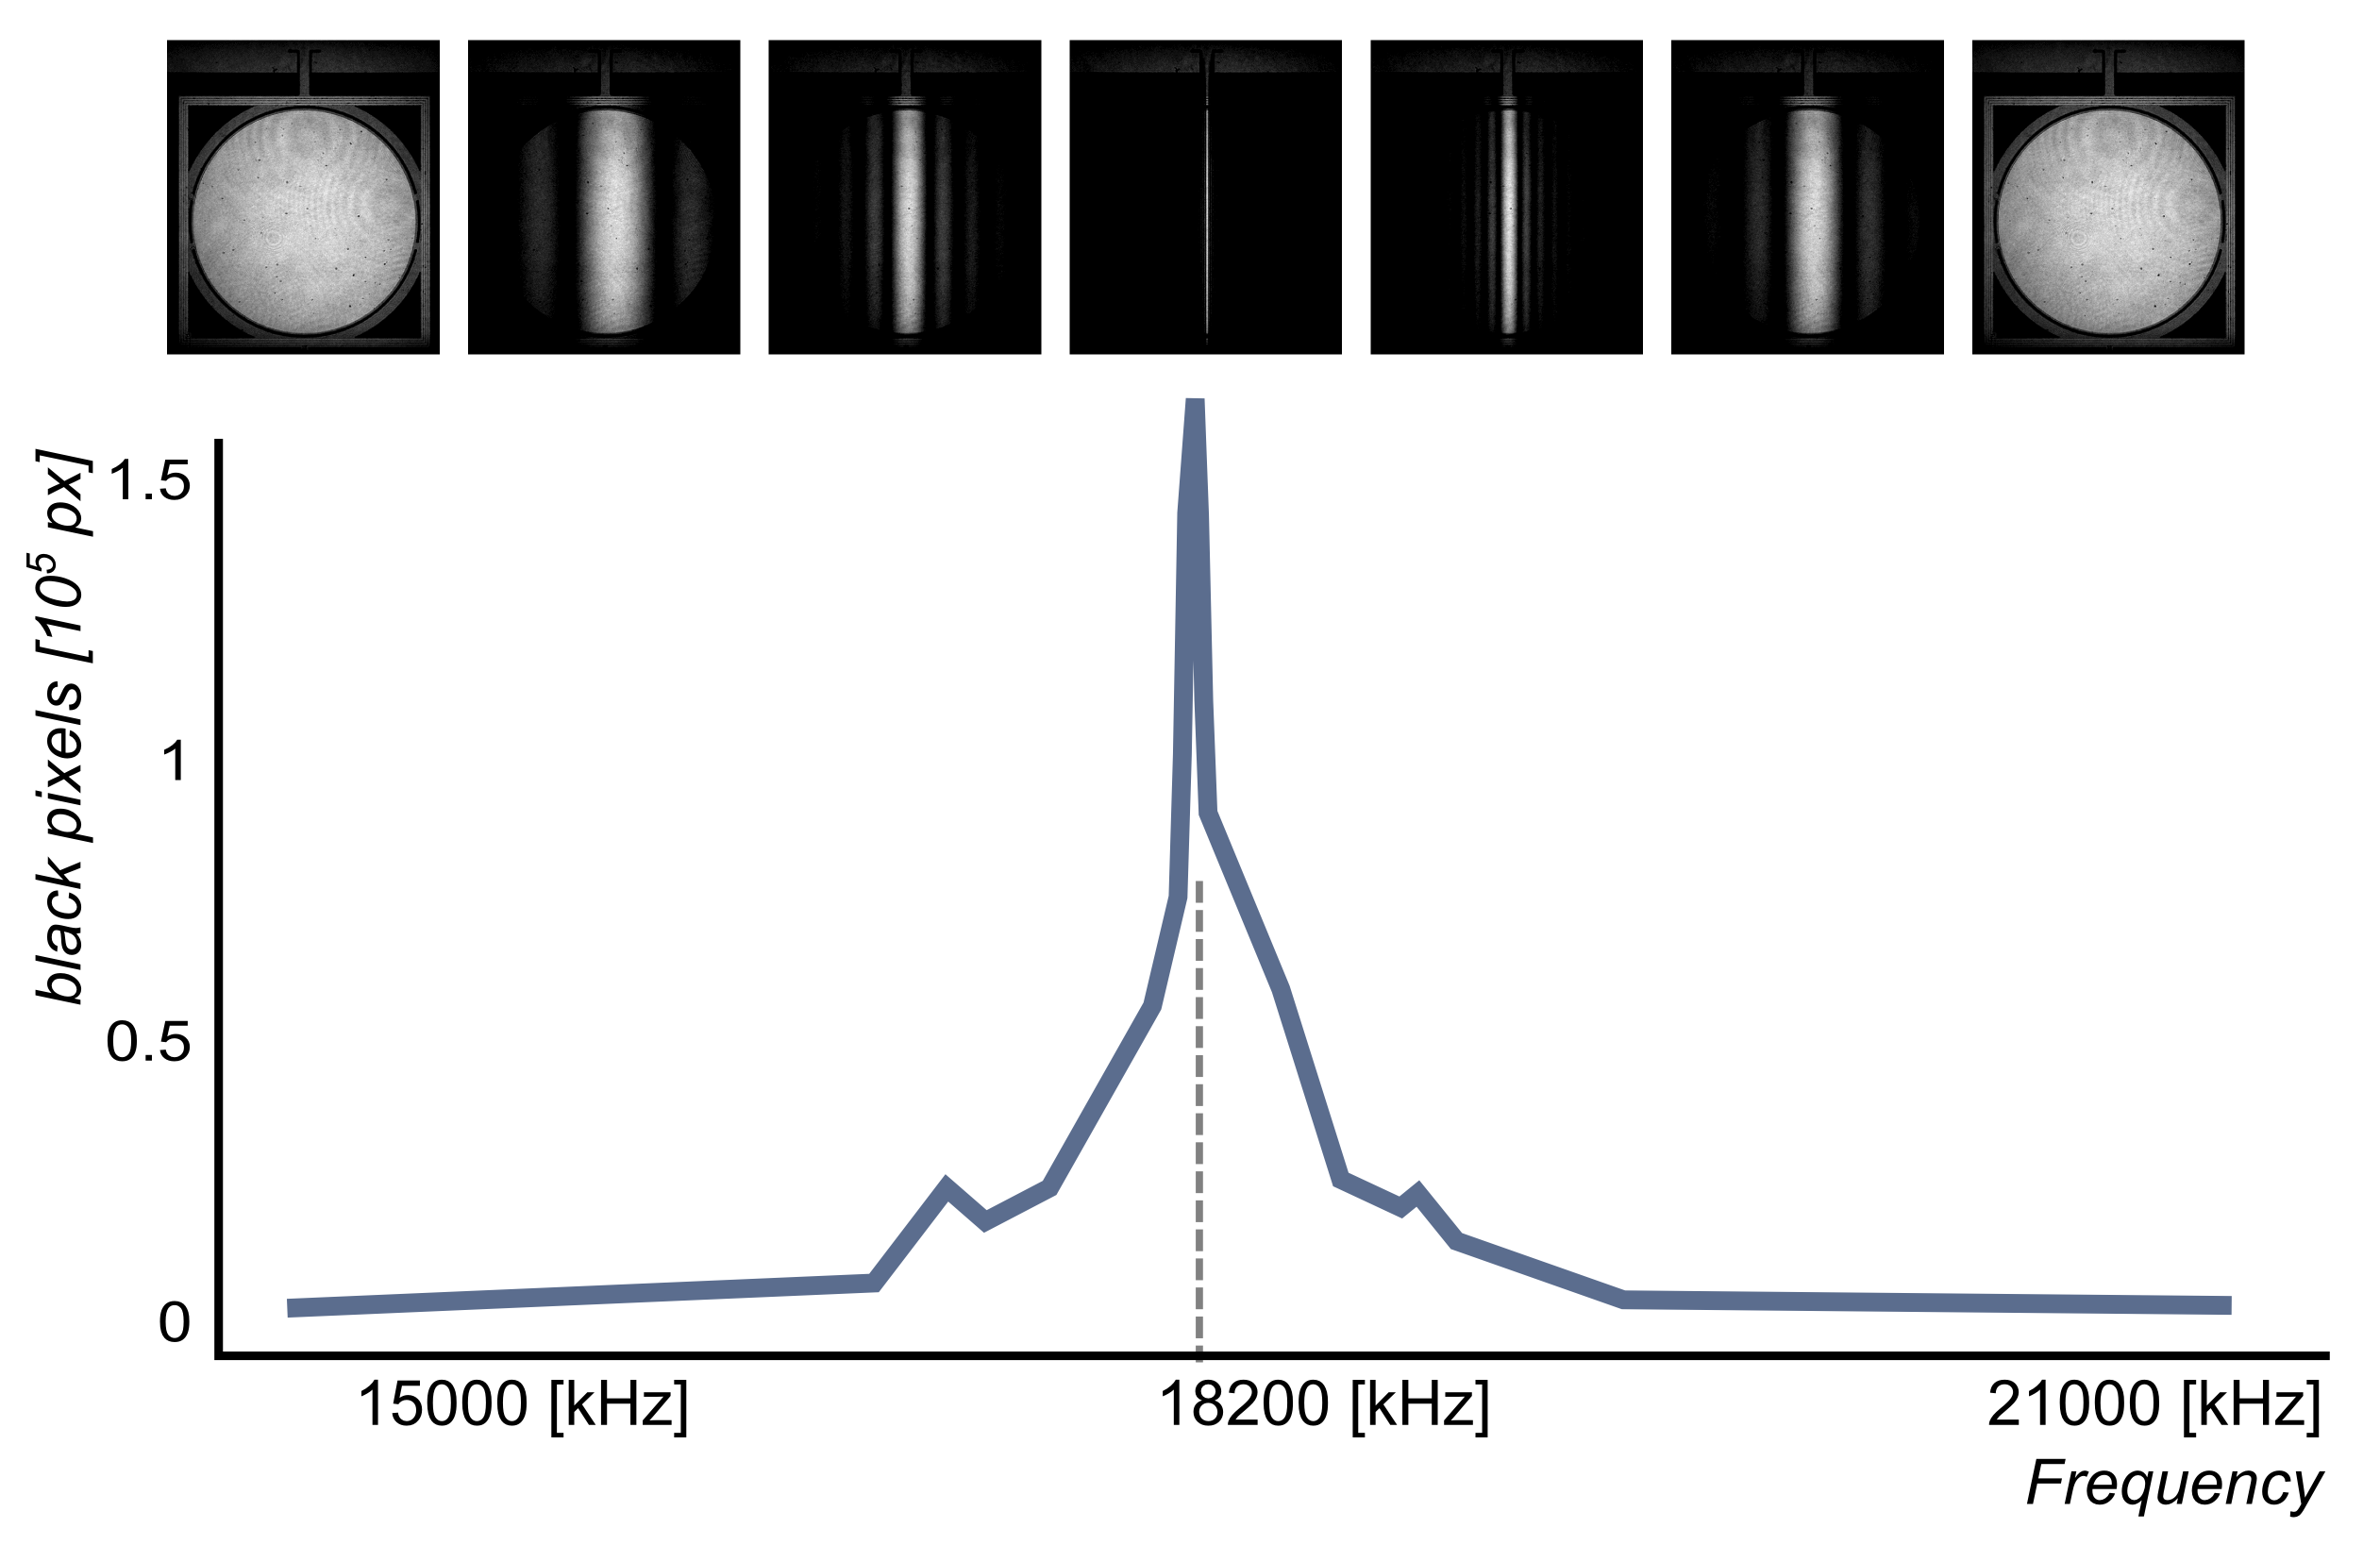
The resonant response of the microdevice is determined by performing a frequency sweep and exploiting the intensity image information, as shown in Fig 1. Indeed, due to interference patterns, the greater the amplitude of the mirror oscillations, the less intensity is measured by the DHM. A single measurement per frequency is sufficient to determine the frequency at which oscillation amplitude is at its maximum amplitude. The method is therefore very fast. Read more details.
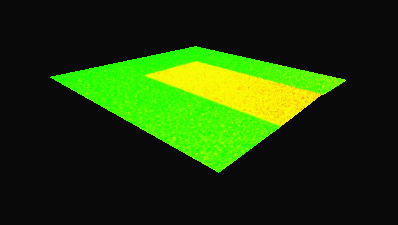
2. Maximum deflection angle determination
Maximum deflection angle of the mirror is also measured using the intensity image information, as shown in Fig 2. The mirror is actuated at resonance frequency and the goniometer automatically sweeps the tilt or tip of the microdevice. When the mirror oscillates at its maximum angle, the speed of the movement is the lowest. Therefore, the goniometer angle for which the intensity image has the largest amplitude corresponds to the maximum vibration angle.
3. Micromirror response phase shift at resonant frequency adjustment
The phase difference between the mirror excitation signal and response is determined by scanning the excitation signal phase offset when the goniometer is set at the maximum mirror deflection angle, as shown in Fig 3. The phase shift value is the median point of the graph of the DHM image intensity versus phase offset function, as shown on the image on the right.
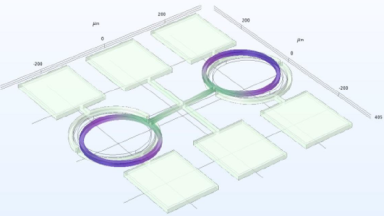
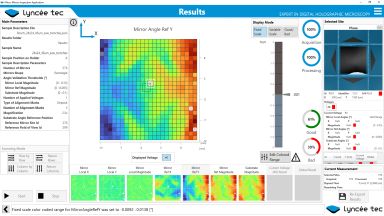
4. Mirror characterization over the full deflection angle range
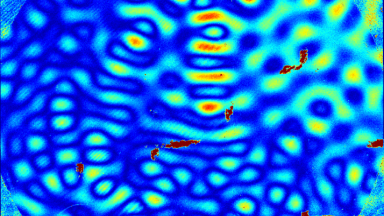
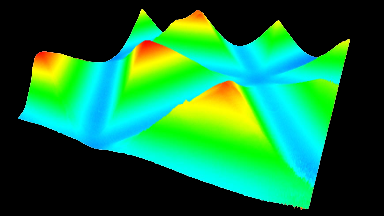
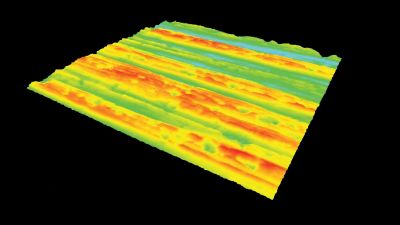
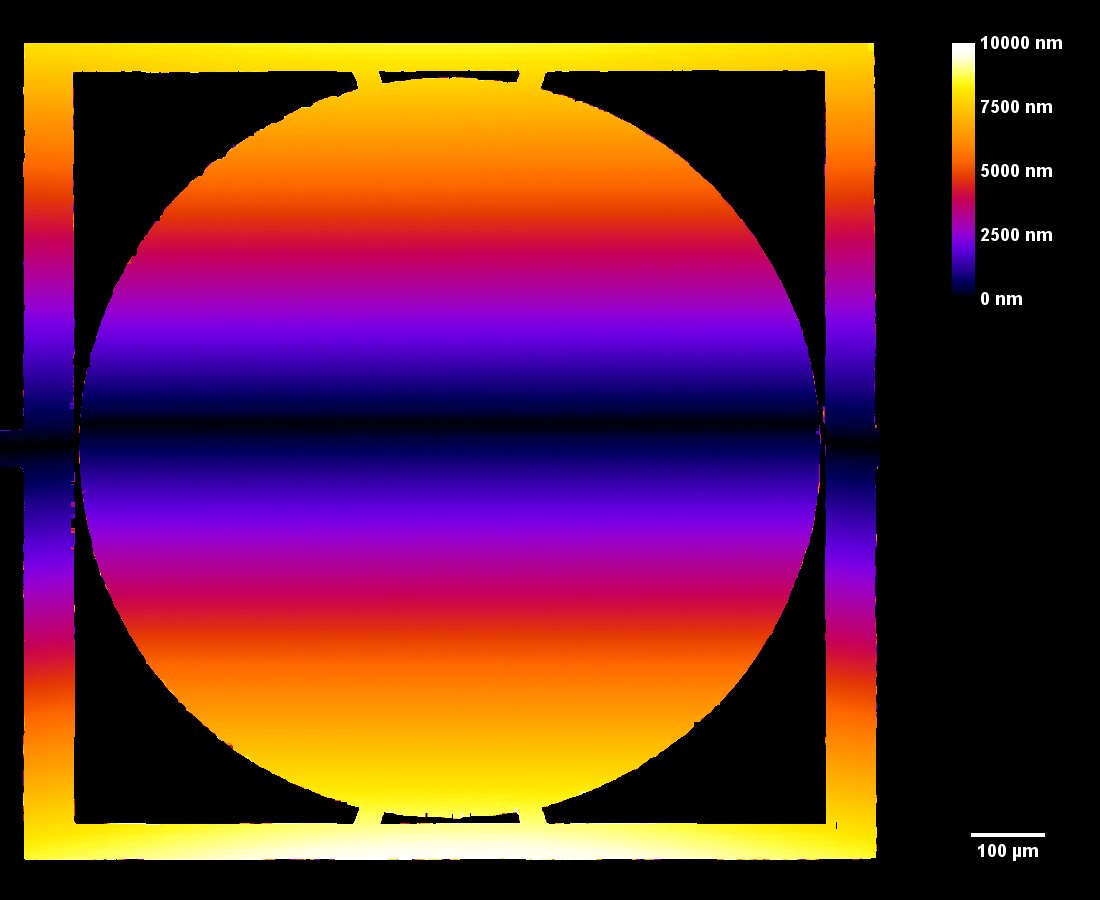
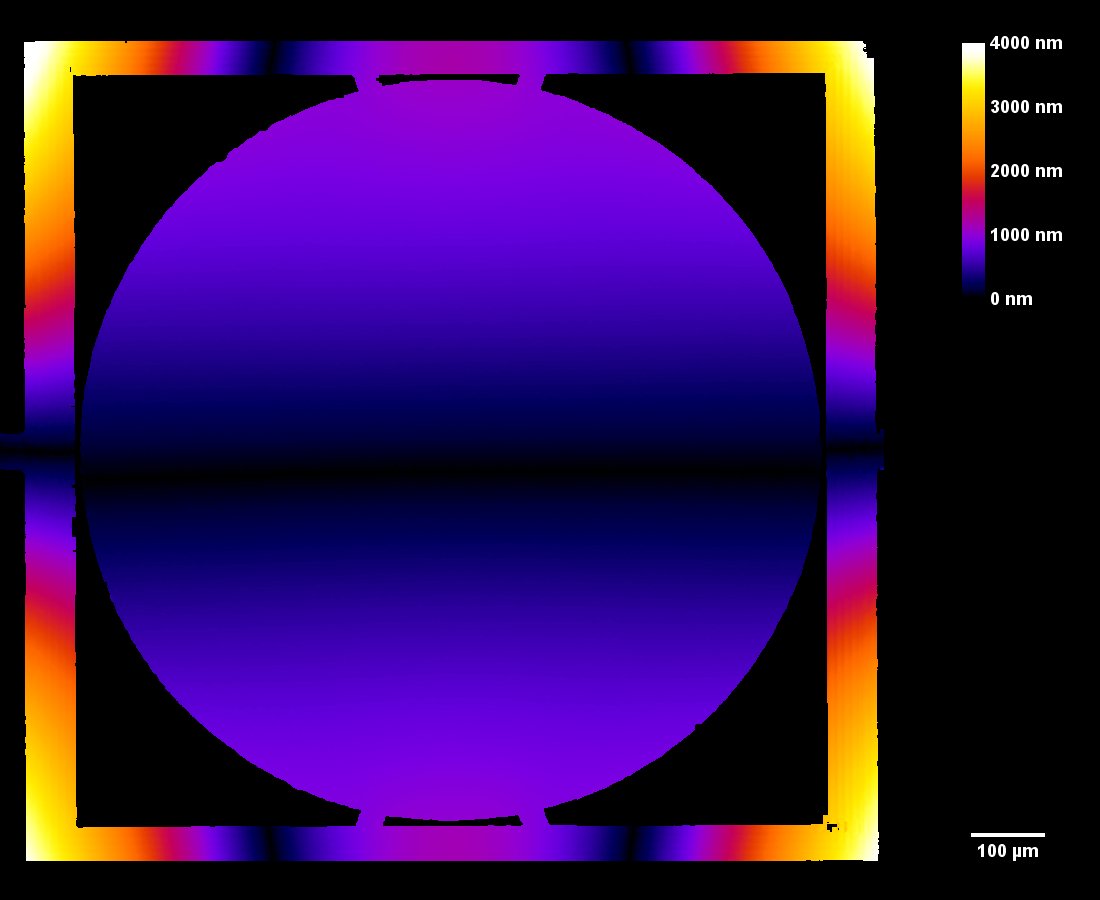
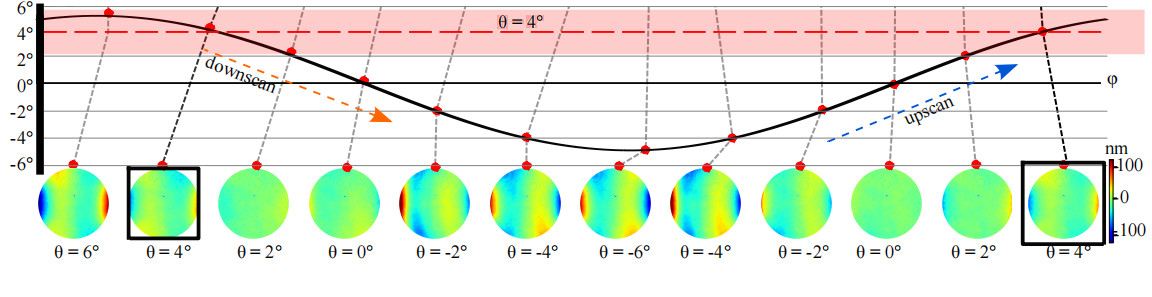
The motorized goniometer adjusts the microdevice tilt and tip using the parameters determined in the previous steps. The mirror’s reflective surface is measured while positioned along its full deflection range perpendicular to the DHM®’s optical axis, as shown in Fig 4.
This measurement can be interpreted into surface dynamical deformation, vibration map, and optical aberrations can be evaluated, as illustrated in the next section.
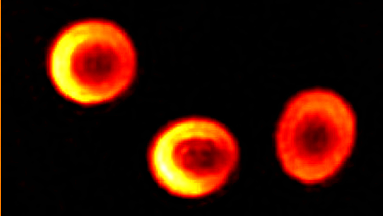
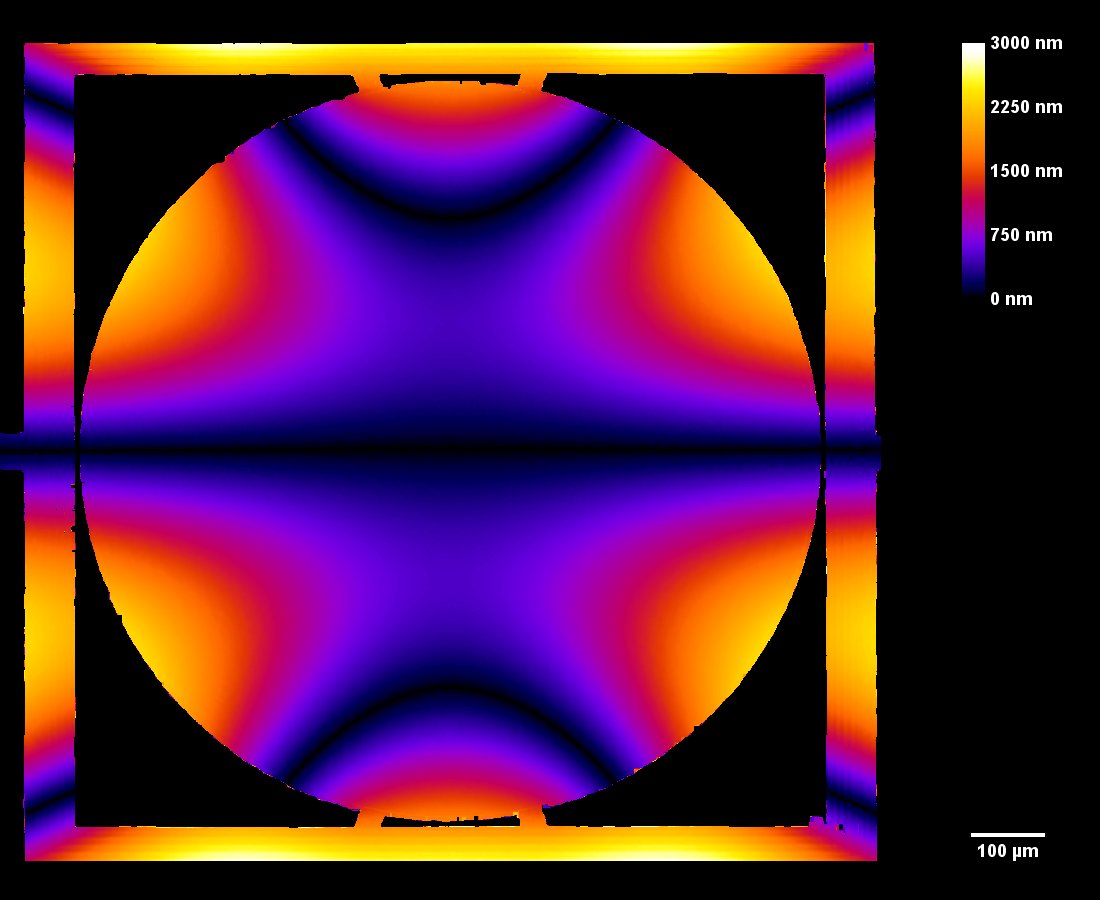
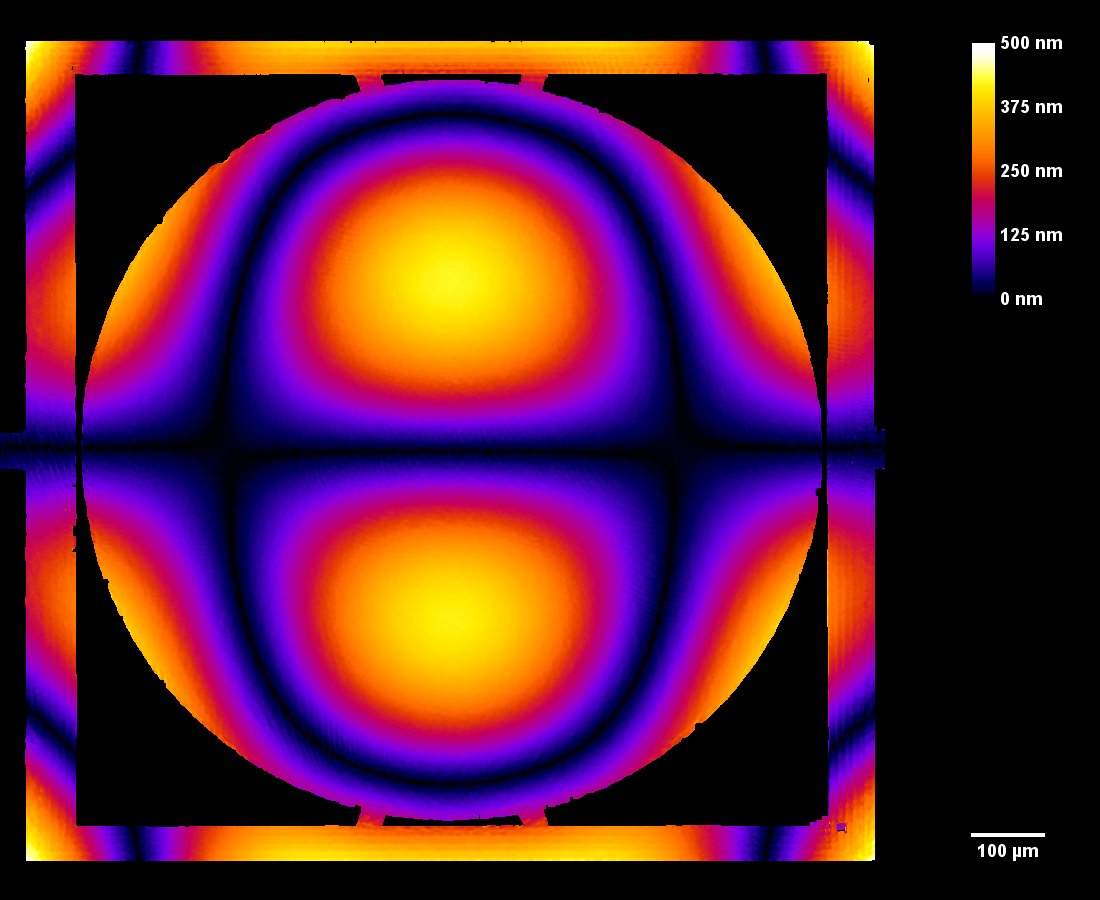
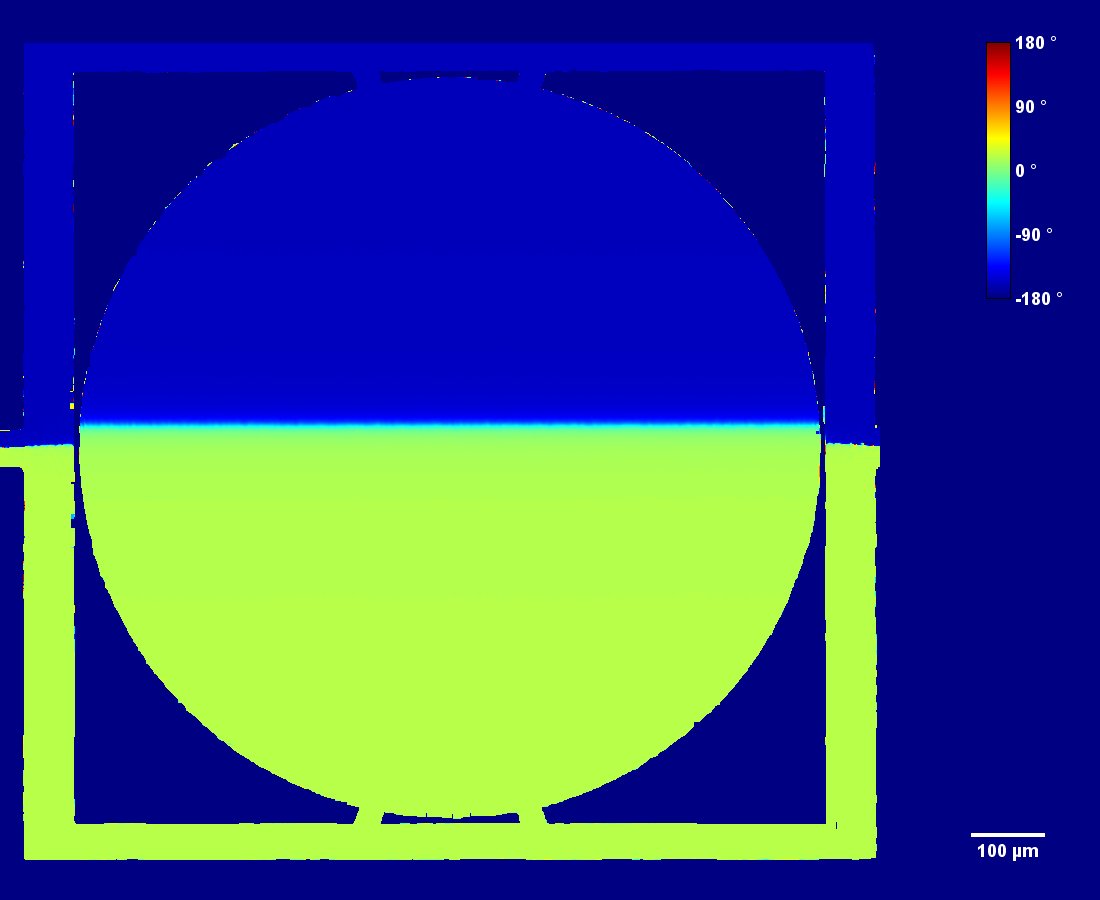
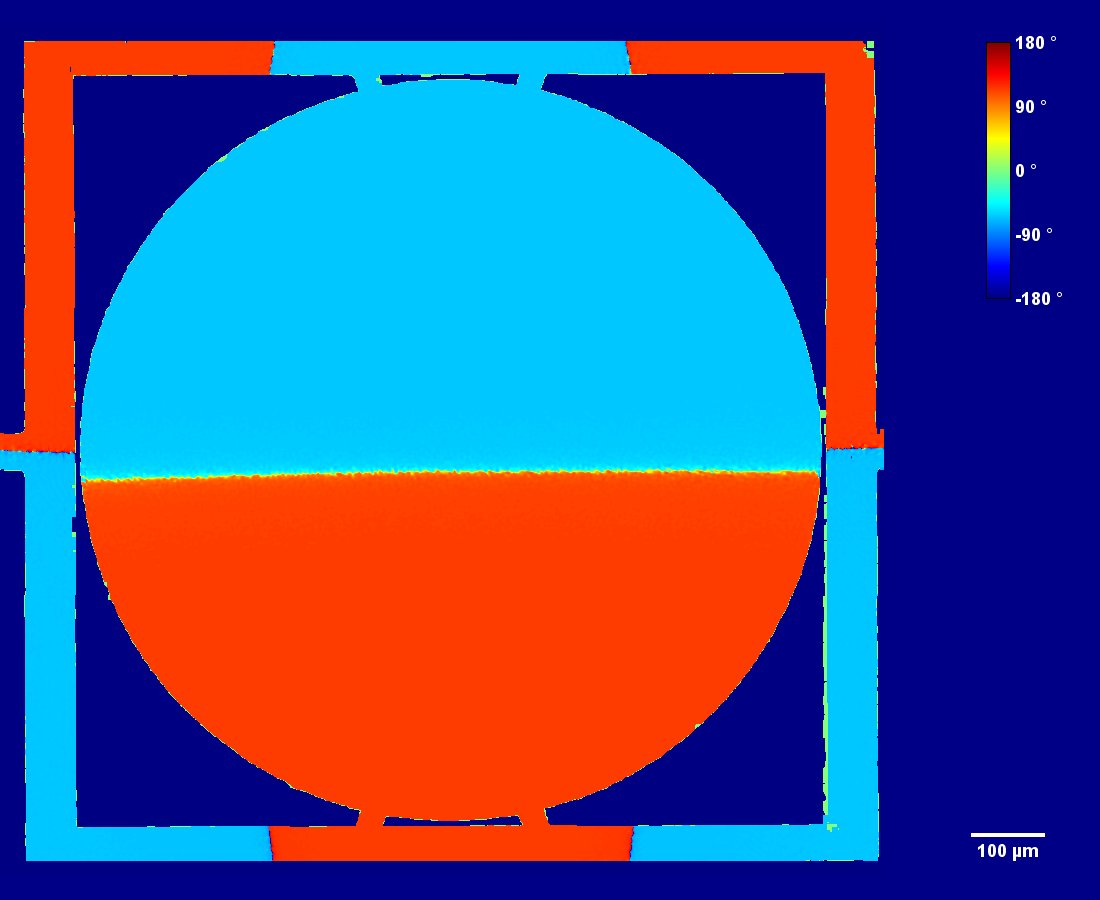
Optical Aberrations Characterization
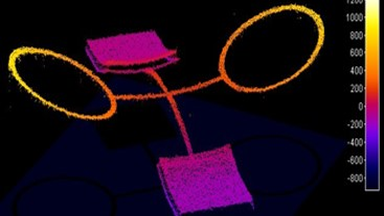
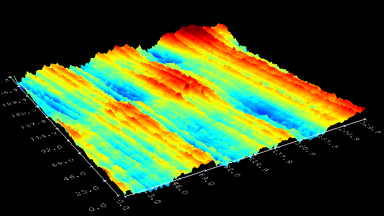
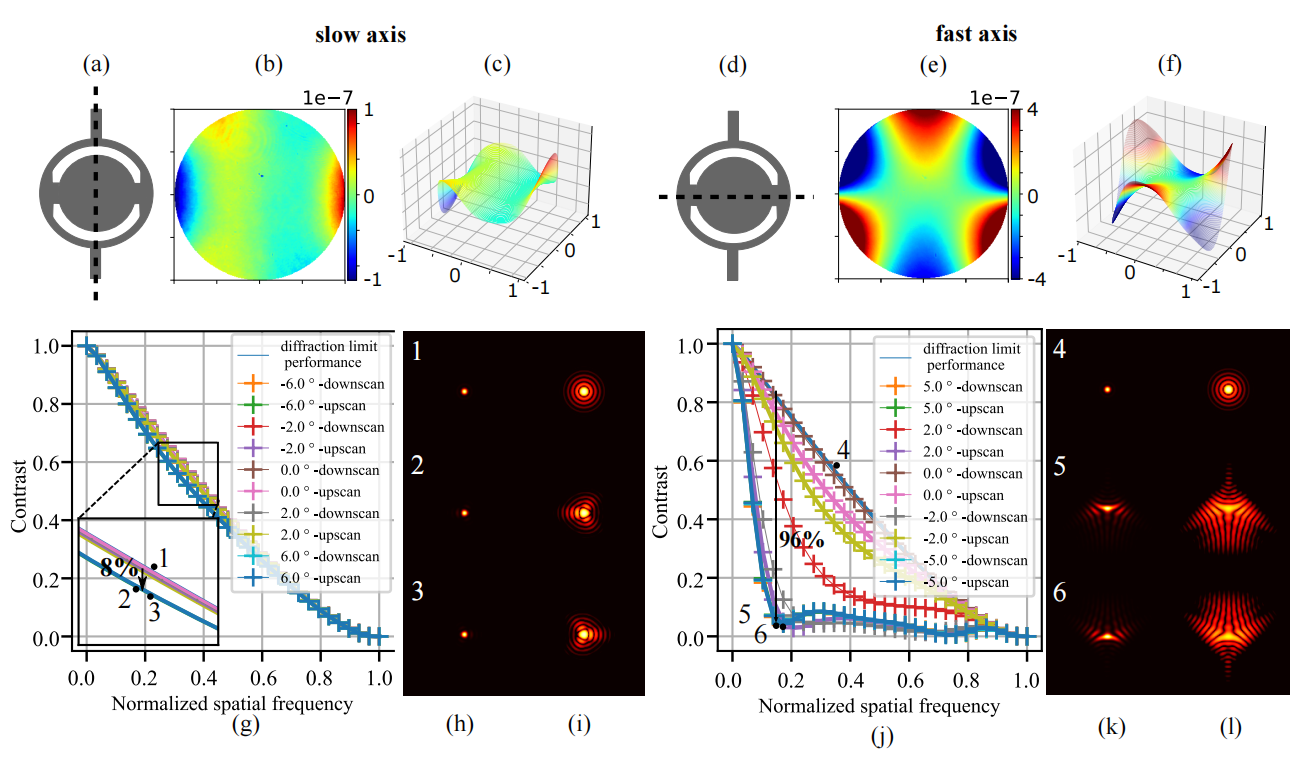
Dynamic measurements of the deformations enables to evaluate the optical aberrations at any phase of the mirror oscillations. For instance, at maximum scan angle of the micromirror, trefoil is visible for the fast axis when the low axis shows trefoil and comma.
In this particular example, slow axis has a dynamic deformation of 250 nm which leads to 8% drop in contrast compared to diffraction limit for the same aperture. The hysteresis observed in this axis, where difference in dynamic deformation for upscan and downscan is 45 nm, accounts for contrast loss of 0.6 %. Fast axis has dynamic deformation of 1600 nm which leads to drop in contrast of 96%. In fast axis mode, image quality degrades with increased angle.
“I am very much impressed by the DHM, on how we can use the laser trigger pulses down to 7.5ns and record the high resolution- surface topographies of a high-speed scanning micromirrors. We received support from Yves on improving our measurements, to deal with high velocity at zero crossing of mirror. Also, I am grateful for his immediate responses and contribution to paper reviewing within a short notice period.”
Pooja thakkar, Junior Scientist, Photonic Systems, Silicon Austria Labs

“Besides having good enough resolution in all 4 dimensions to image such a small and mechanical deformation, the key aspect of stroboscopic holography for high deflection MEMS mirror is to explore the parameter window space first (full field) contrary to a scanning technique – i.e LDV – that would do it frequency first. This enables easy and precise measurement, and a straightforward processing scheme.”
Clement Fleury, Senior Researcher, Photonic Systems, Silicon Austria Labs

“Experimental characterization of dynamic deformation at larger optical scan angles has for long time remained underexplored. Digital holographic microscopy offers superior lateral, axial and temporal resolution, allowing us to study peculiar effects in angle resolved membrane dynamics. Lyncée Tec offers you the right tool for the job.”
Dr. Jaka Pribošek, Senior Scientist, Photonic Systems, Silicon Austria Labs

Resonant frequency analysis by DHM in three ways
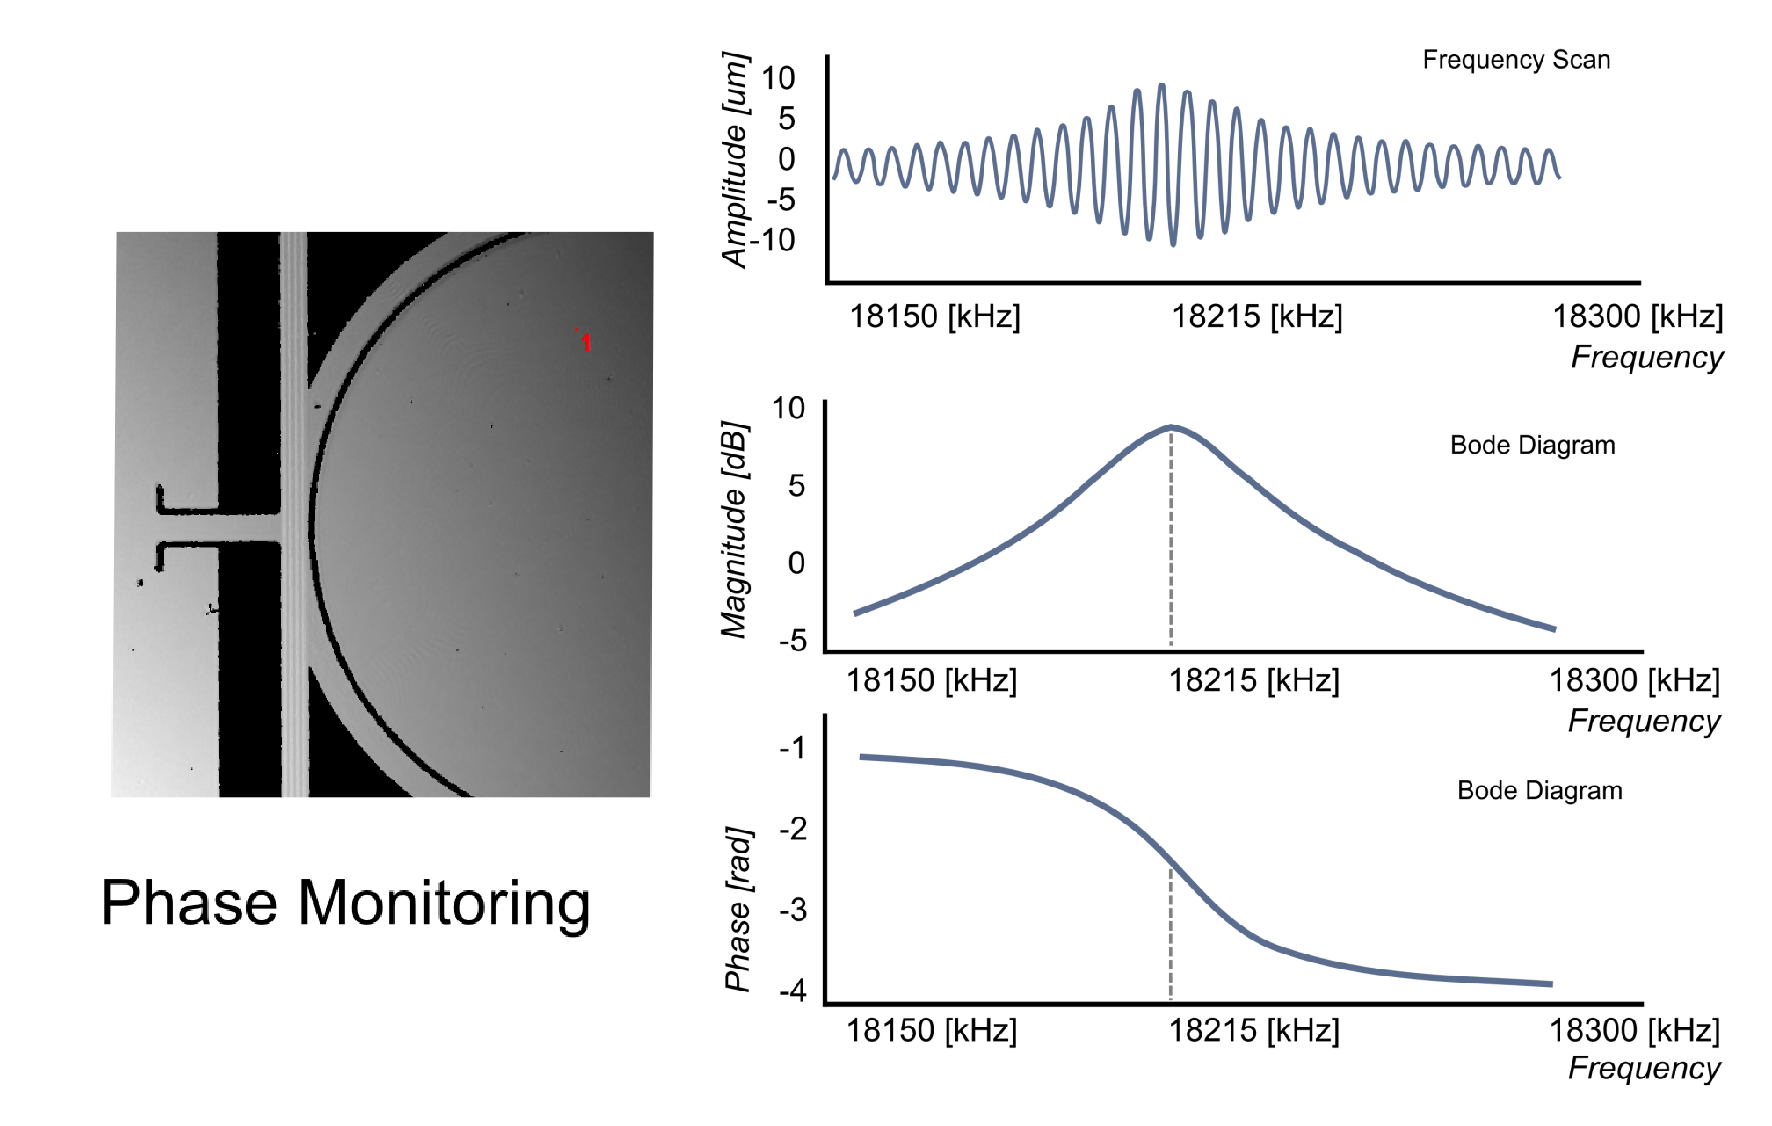
1. Phase and Intensity Frequency scan with high temporal resolution
Frequency scan with high temporal resolution is the method providing the most accurate and complete information. It enables to investigate in- and out-of-plane linear and nonlinear resonances for the full frequency range from static up to 25 MHz, with a precision of 0.1 Hz, and with an interferometric resolution. This is possible as well in presence of complex geometry (presence of holes) and complex movements (combined tilt, in and out of plane displacements). It is an ideal method for resonance characterization. It can be used for certain samples in complement to one of the two others which may provide faster resonance detection. Considering the amount of information provided by the method, the analysis time is eventually very competitive.
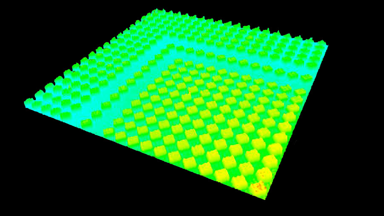
This information is a real need for the dynamical analysis of MEMS with complex geometry, complex movement combining tilt of structure, in presence of sacrificial holes, or for a statistical analysis of a grid with multiple devices. The analysis of data provides quickly and efficiently displacement amplitude for any pixel of the image, Bode diagrams analysis, and resonance quality factor determination for any point of the field of view.
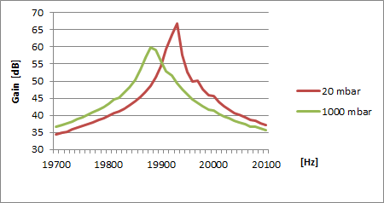
Thanks to the DHM® unique optical configuration and the large objective collection , it also enables measurement and frequency analysis through glass viewport in a vacuum environment.
Published in SPIE Photonic West 2013.
2. Frequency scan with Intensity measurements analysis
This second method performs a frequency scan with a sine wave, similarly to the first method. But only the intensity measurements are exploited. Moreover, instead of using short laser pulses compared to the period of the microsystem, laser pulses length is set equal to the duration of one period of the MEMS excitation. This method enables a fast scan of large range of frequencies and to determine quickly linear and nonlinear resonances, and their relative amplitude.
Frequency scan with intensity analysis provides a fast measurement of linear and nonlinear resonances for samples with vertical displacements amplitude larger than typically >100 nm, which is not a limitation for many samples. Contrary to the two other methods which provide both in- and out-of-plane displacements, only out-of-plane information can be exploited. It enables to investigate the full frequency range up to 25 MHz with resolution of 0.1 Hz.
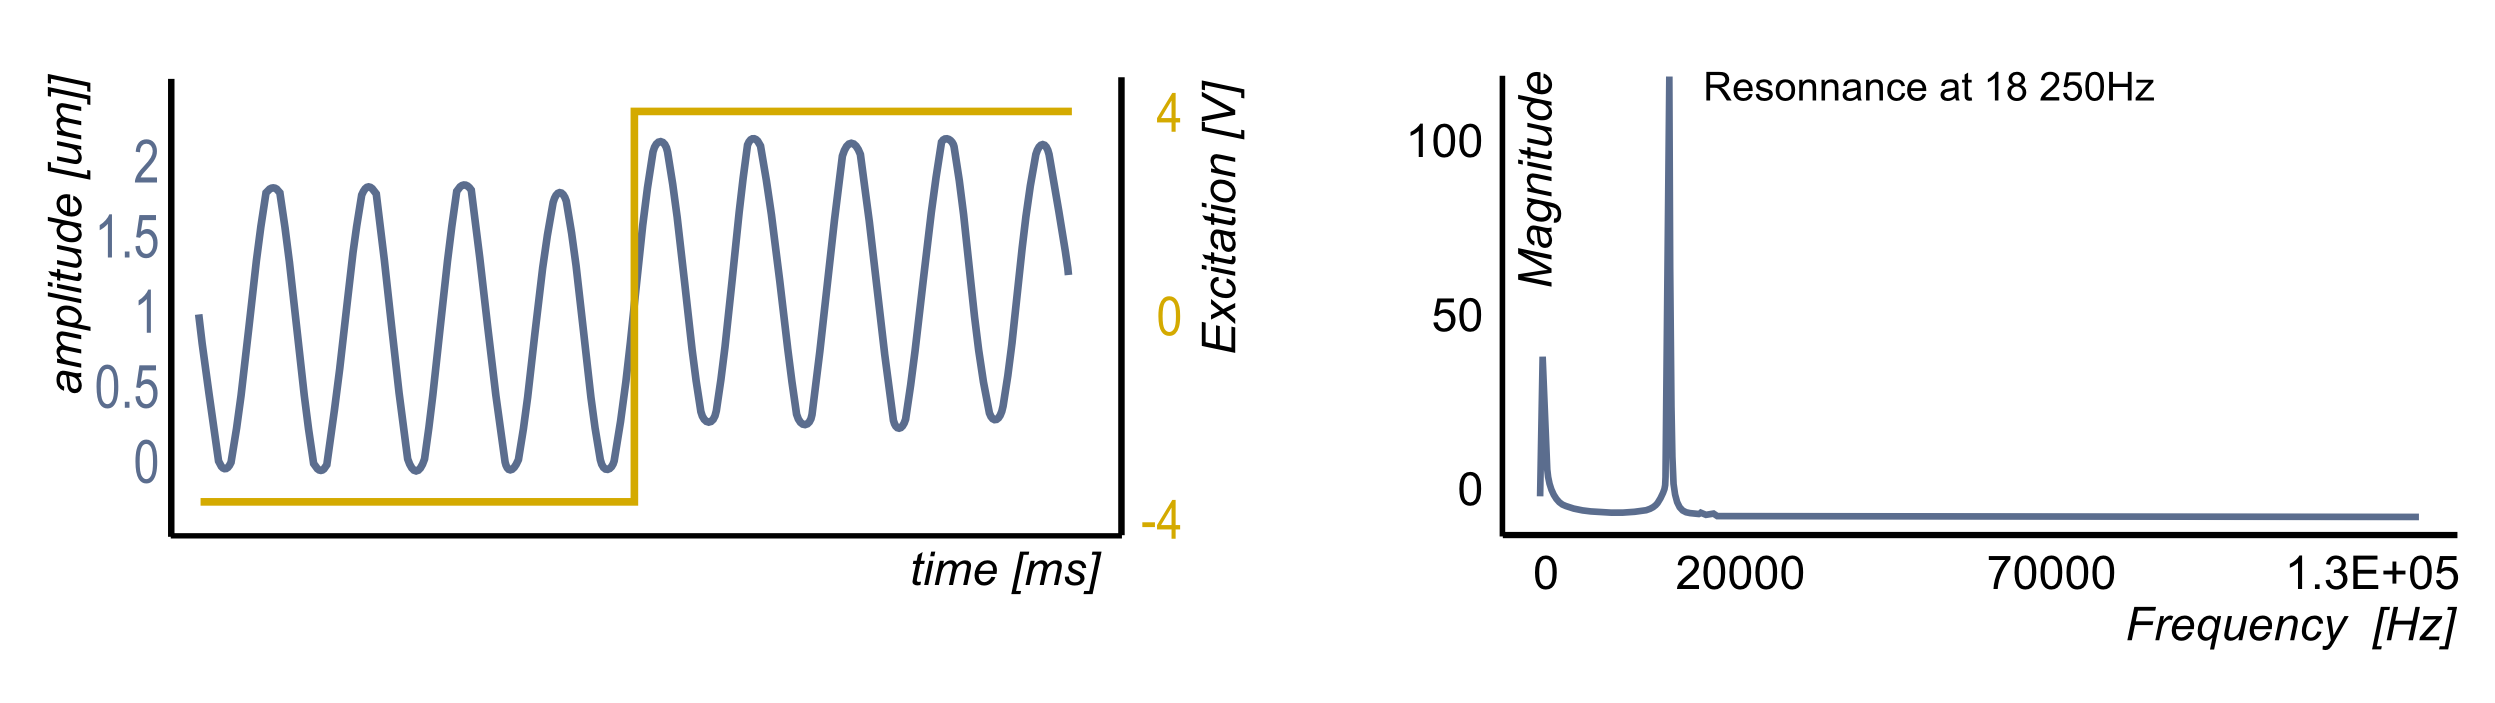
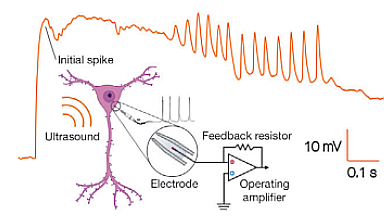
3. Fourier transform of the system response
Fourier response analysis method is efficient and well known, but less sensitive as the excitation energy is spread into a large spectrum of frequencies. It enables determination of linear in- and out-of plane resonances over large frequency range in a reasonable time, without frequency scanning. The frequency resolution is not as high as for the two other methods; it is limited for practical reasons to about 100Hz. This can be a limit for high quality resonance detection. The topography is measured with an interferometric resolution. Its use for investigation of nonlinear resonance is generally not possible.
The right figure shows the Fourier analysis of the resonance of a micro-mirror using a DHM. A square excitation signal at 250 Hz is generated by the stroboscopic module to excite the mirror. This square contains a large spectrum of excitation frequencies. The micro mirror response is sampled with the stroboscopic synchronization. This time response is represented for a single point of the surface on the figure. The oscillations are the signature of the resonant frequency. This is confirmed by the Fourier transform of this response: the resonance peak is detected at 18 kHz.