声学 MEMS Microphone
Measurement through the back-plate
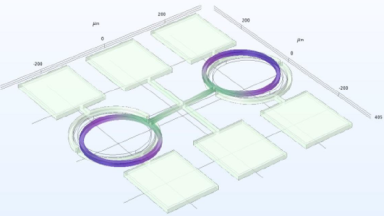
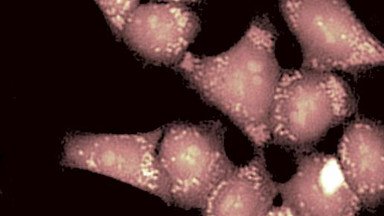
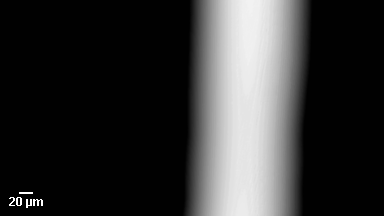
A MEMS microphone is composed by a diaphragm vibrating between on or two holed back-plates. Measurement of topography and vibration modes of each the diaphragm is challenging :
- Diaphragm is measured through the back-plate. High lateral resolution is required
- The thin 1 um back-plate silicon membrane is transparent for visible and near IR illumination. UV laser source is required
Description
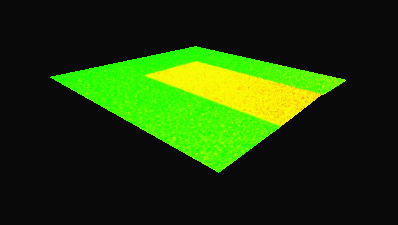
- Diaphragm diameter : 100 μm
- Magnification : 20x
- Lateral resolution : 0.5 μm
- Excitation frequency : 1 kHz
- Instrument : DHM R-1000 equipped with UV laser source
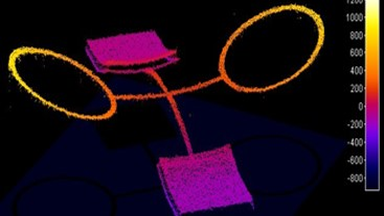
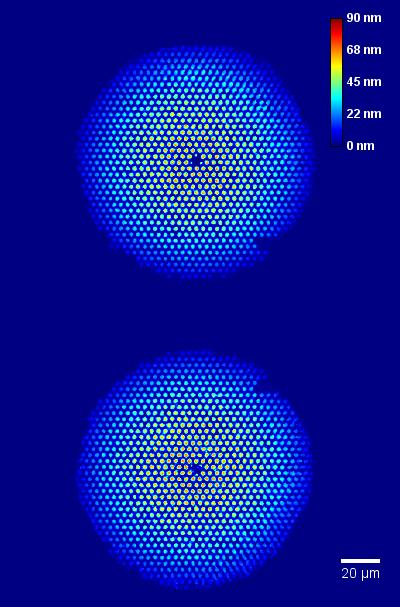
Vibrations measurement
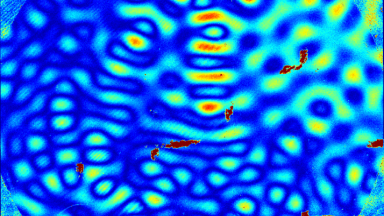
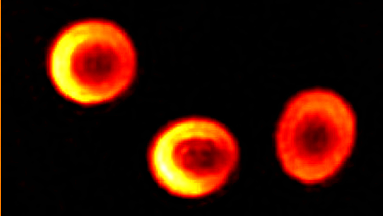
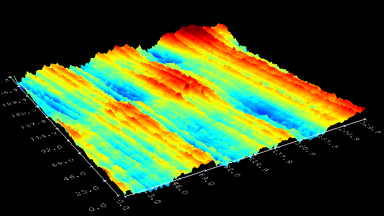
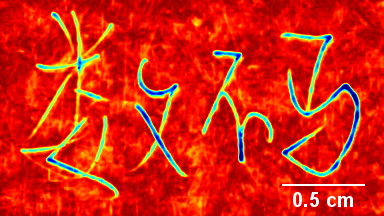
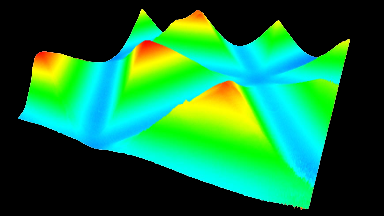
The amplitude vibration map shows the diaphragm vibrations when the microphone is excited as a speaker by the stroboscopic unit at 1 kHz. The first vibration mode of both diaphragm is represented.
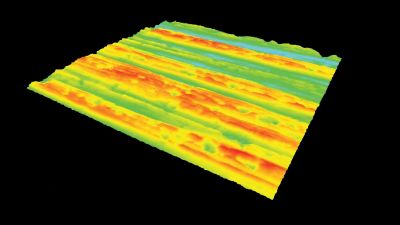
Full field of view Bode plot
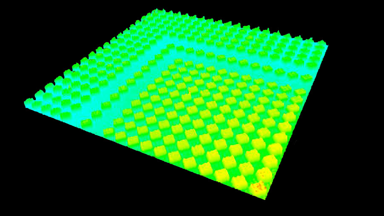
Vibration amplitude maps of a microphone back-plate for frequencies between 100 and 500 kHz by step of 4 kHz.
It enables to visualize not only the main resonance modes, but also the spurious and competing modes.
This animation is the generalization of a 1D Bode graph, generally measured on a single point of the sample. It is measured here for the full filed of view.

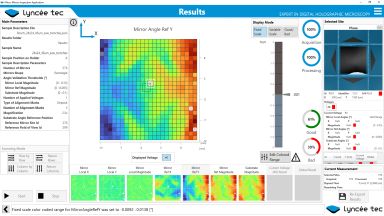
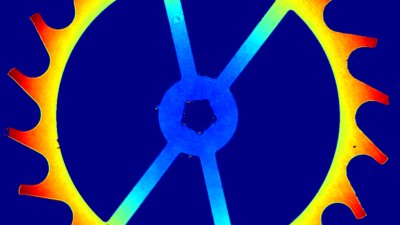
Membrane and back-plate vibrations
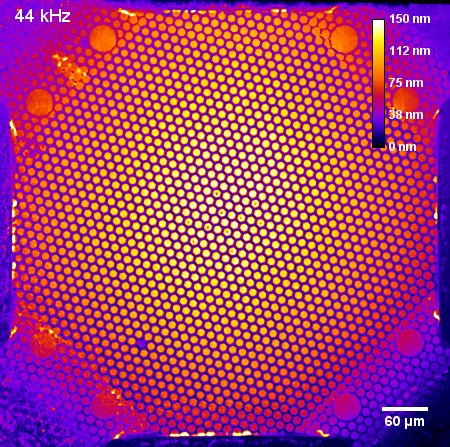
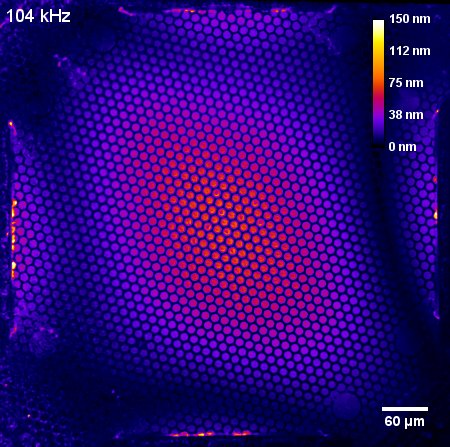
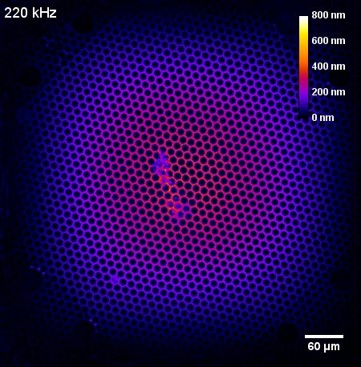
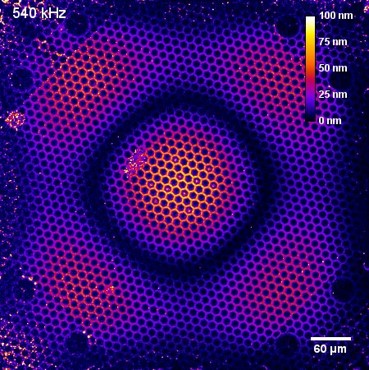
The four measurements here below illustrate the perfect discrimination between the measurement of the vibration of the main membrane and of the back plate.
- The two first amplitude vibration maps are measured @44 kHz and 104 kHz. Their vibration amplitude is measured inside of the holes of the back-plate. The grid of the back-plate shows nearly no vibrations.
- The third and fours amplitude vibration maps are measured @362 kHz and 540 kHz. Their vibration amplitude is measured inside of the holes of the back-plate is zero. The vibration of the back-plate is measured on the grid.