MEMS瞬态分析MEMS Transient Analysis
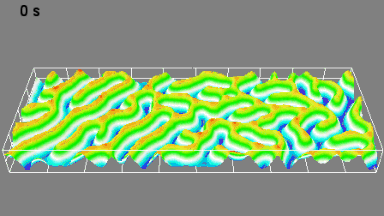
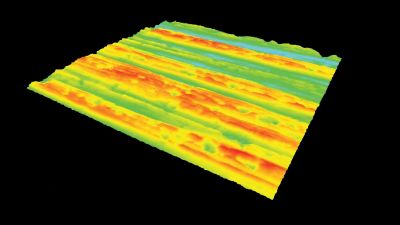
Unlike systems measuring the displacement of a single point on the surface of a sample, DHM®‘s unique non-scanning technique measures time-sequence of the sample surface with 3D topographies at mega pixel resolution. Indeed, each individual measurement is acquired simultaneously over the full field of view, providing at each time-point a million of data-points. This unrivaled wealth of information reveals very quickly and efficiently MEMS response to any excitation signal with unprecedented details.
As an illustration this application presents a cMUT membrane transient response to a burst excitation signal. Both time and frequency domains analysis characterization are presented. Such analysis can be further applied to arrays of cMUT and pMUT membranes, as well as to other transducers such as inertial sensors, optical and mechanical switches, MEMS microphones, among others.
Time Domain Measurements
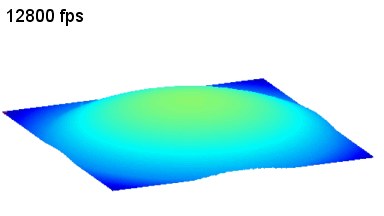
The stroboscopic unit electronics precisely samples the measurement of topographies along the excitation waveform. It allows to acquired time-sequence of up to 32’768 3D measurements at a bandwidth of up to 200 MHz.
Using DHM, the time domain time-sequence measurement of the response of a CMUT to a burst excitation provides:
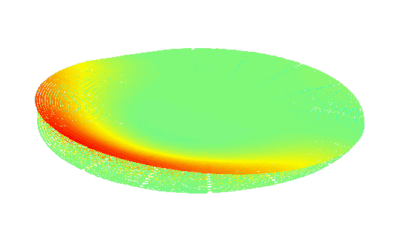
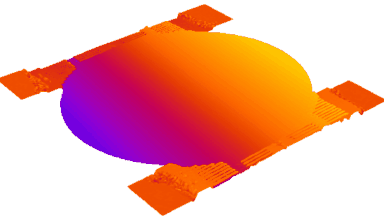
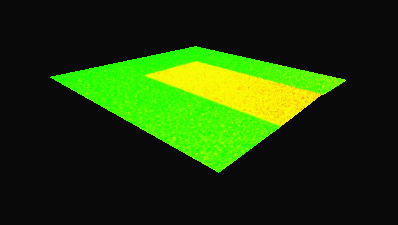
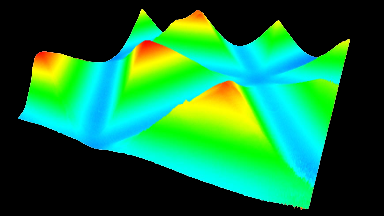
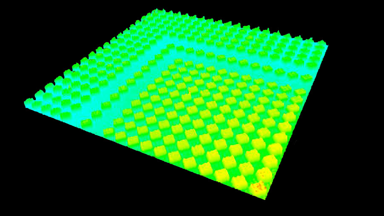
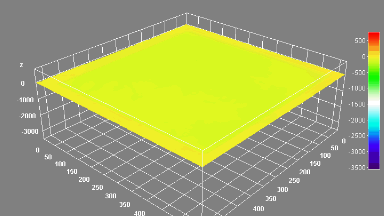
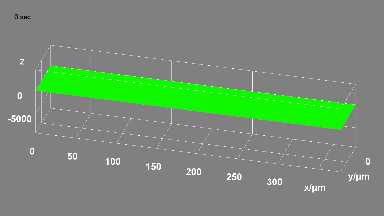
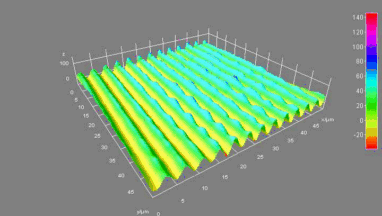
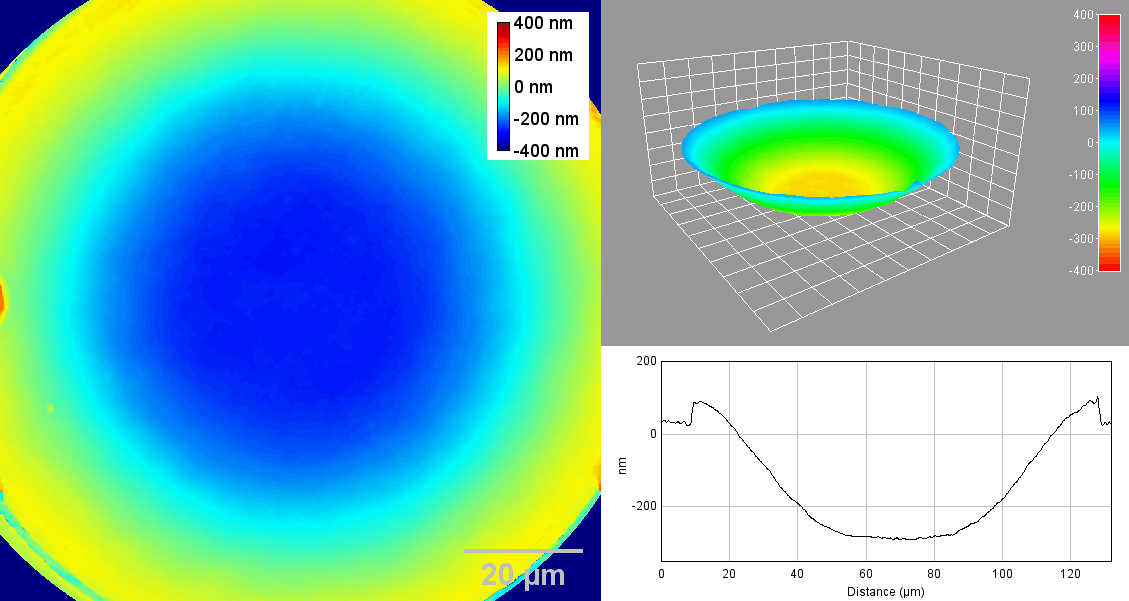
- 3D surface topography versus time (Fig 1)
- Animated profile cut, at any coordinates of the sample. In the application of Fig 1, it provides precise information of membrane deformation.
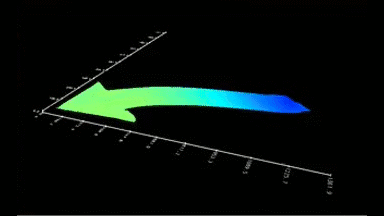
- Absolute vertical position (and therefore displacement) of any point of the surface of the sample (Fig 2)
Excitation waveform specifications – transients
Lyncée’s stroboscopic unit allows users to define any arbitrary excitation waveform with a resolution of 215 points. The strobe electronics generates this waveform and synchronizes very precisely the 3D topography measurements with it (detailed specifications).
Therefore, excitation waveforms not only include “simple” signals such as Sine, Square, Triangle, Trapezoid, or Saw tooth but also, among others, impulses and bursts, enabling to investigate damping and respectively transient processes.
Note: DHM provides absolute vertical position and displacement measurements. As opposed to Doppler vibrometers, the vertical displacements are not calculated by the integration of a velocity measurement along the time, which avoids potential measurements drifts.[:de]
Anmerkung: Das DHM liefert absolute Messungen, sowohl in der Vertikalen wie auch in der Ebene. Im Gegensatz zu Doppler-Vibrometern wird die vertikale Auslenkung nicht über die Integration einer Geschwindigkeitsmessung über die Zeit ermittelt, was potentielle Messabweichungen ausschliesst.
Frequency Domain Analysis
The time-sequences measurements presented above can be transformed in the frequency domain by performing a Discrete Fourier Transform (DFT). The number of spectral bins (or channels) is equal to the total number of temporal samples (i.e up to 32’768), enabling to perform precise vibration modes analysis.
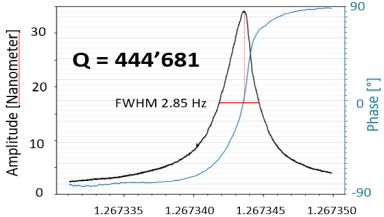
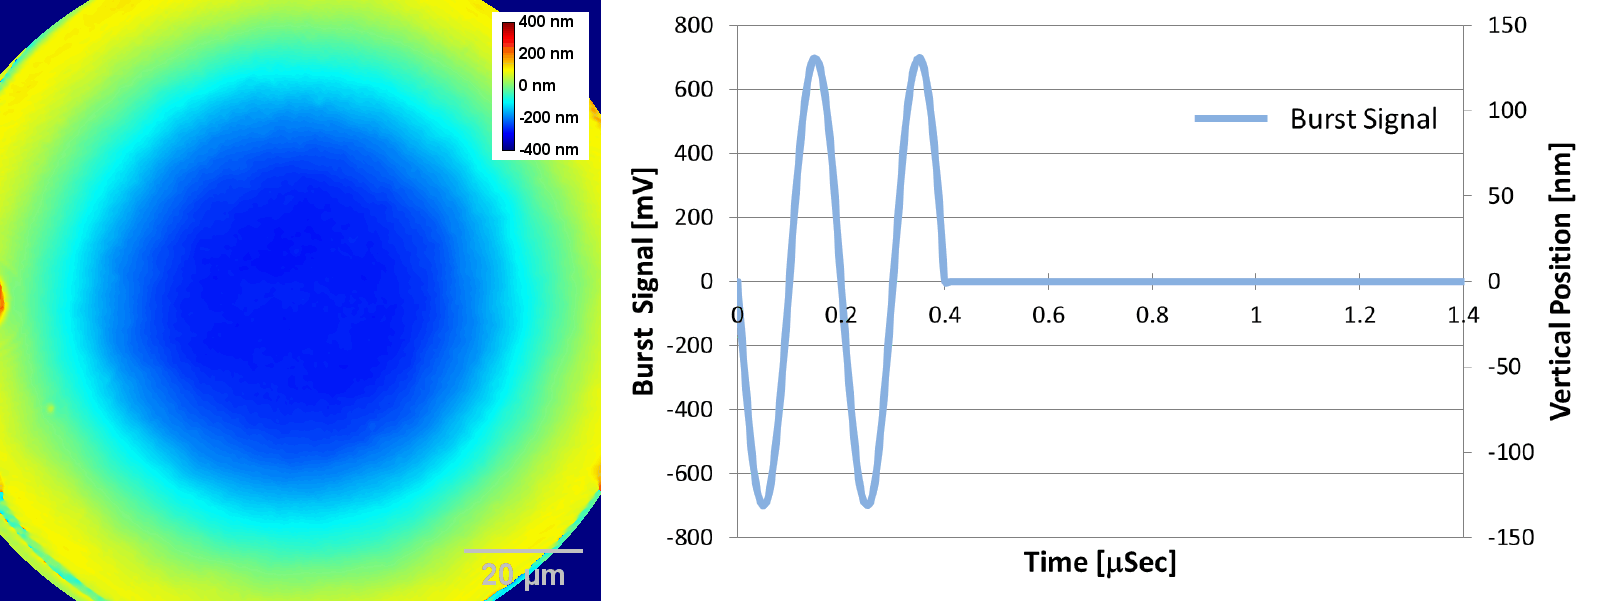
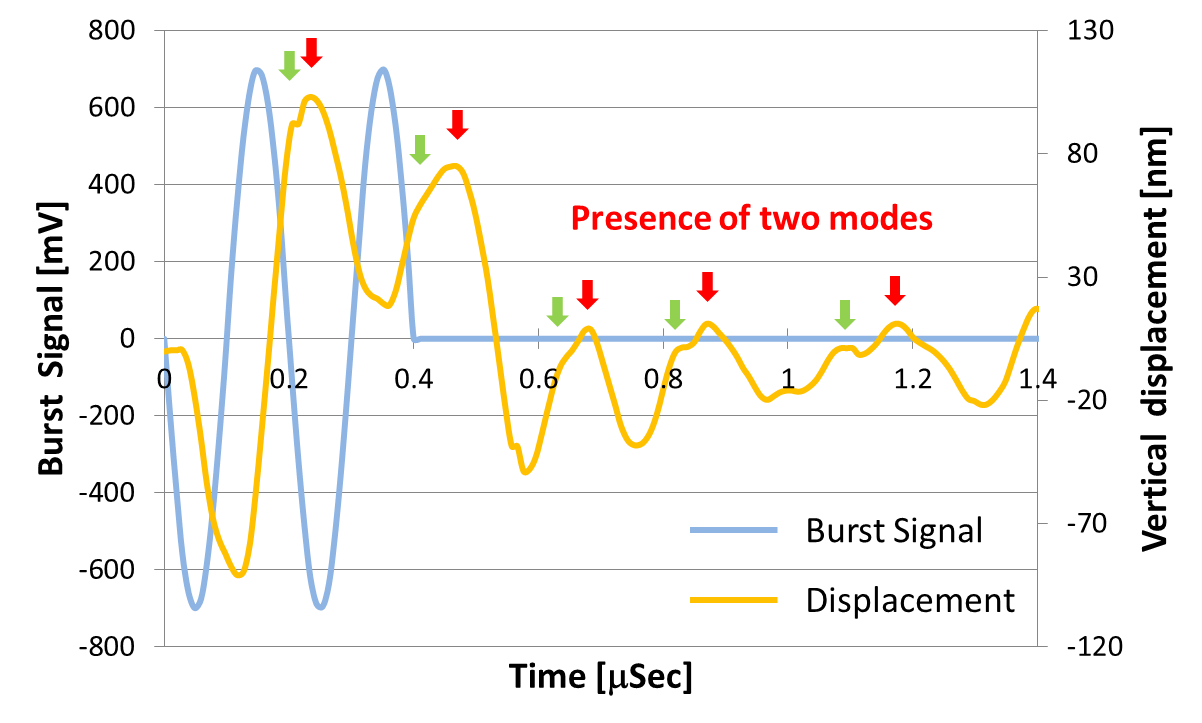
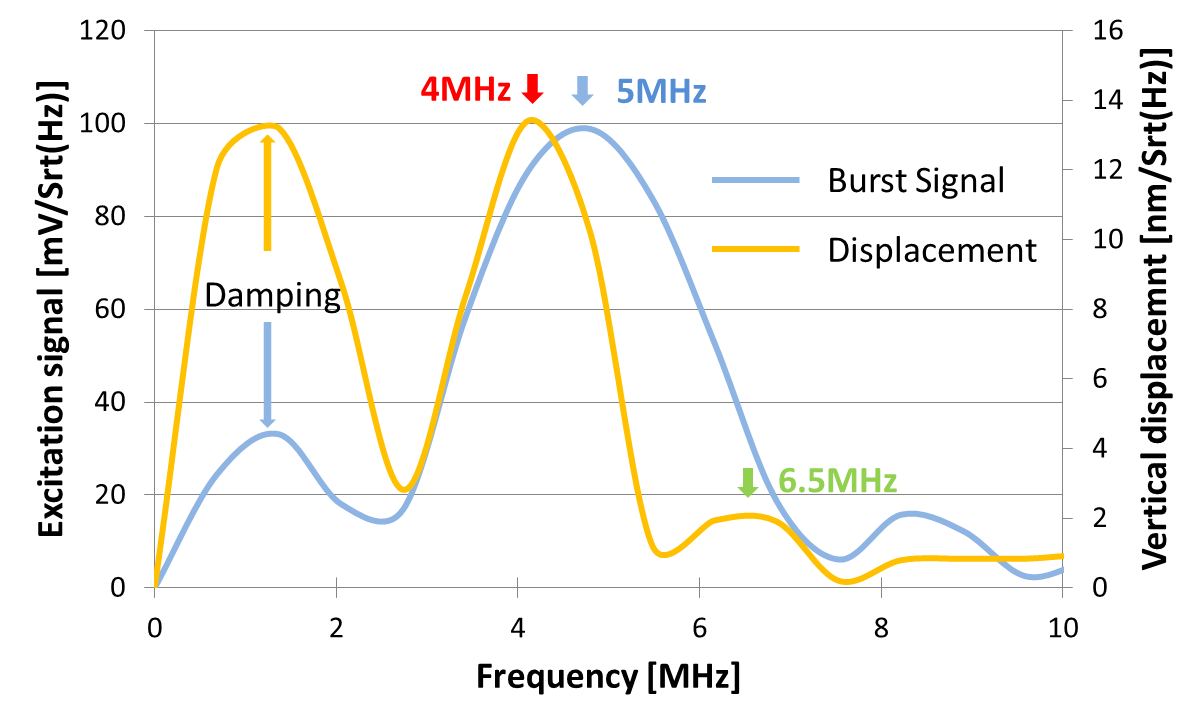
This is illustrated in Fig. 3 and 4. The time response of the position (or displacement) of the surface of the membrane at a given area (Fig. 3) is transformed in the frequency domain (Fig. 4). Its analysis indicates the presence of two modes in the response curve at 4MHz (in color red) and 6.5MHz (in color green) as a response to the double burst excitation signal at 5MHz (in color blue). The presence of two modes is linked with the asymmetrical conception of the cMUT element.
Using DHM, the modal analysis of a cMUT response to a burst excitation provides:
- Fourier analysis of the displacement of any random point or area of the surface of the sample (Fig 4).
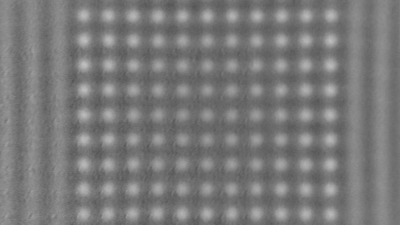
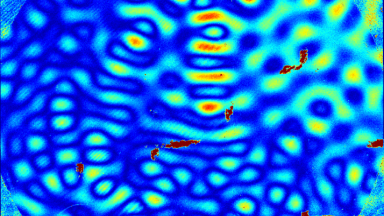
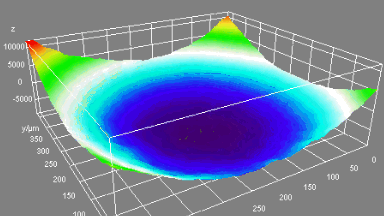
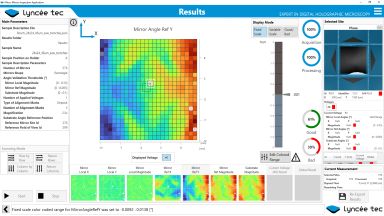
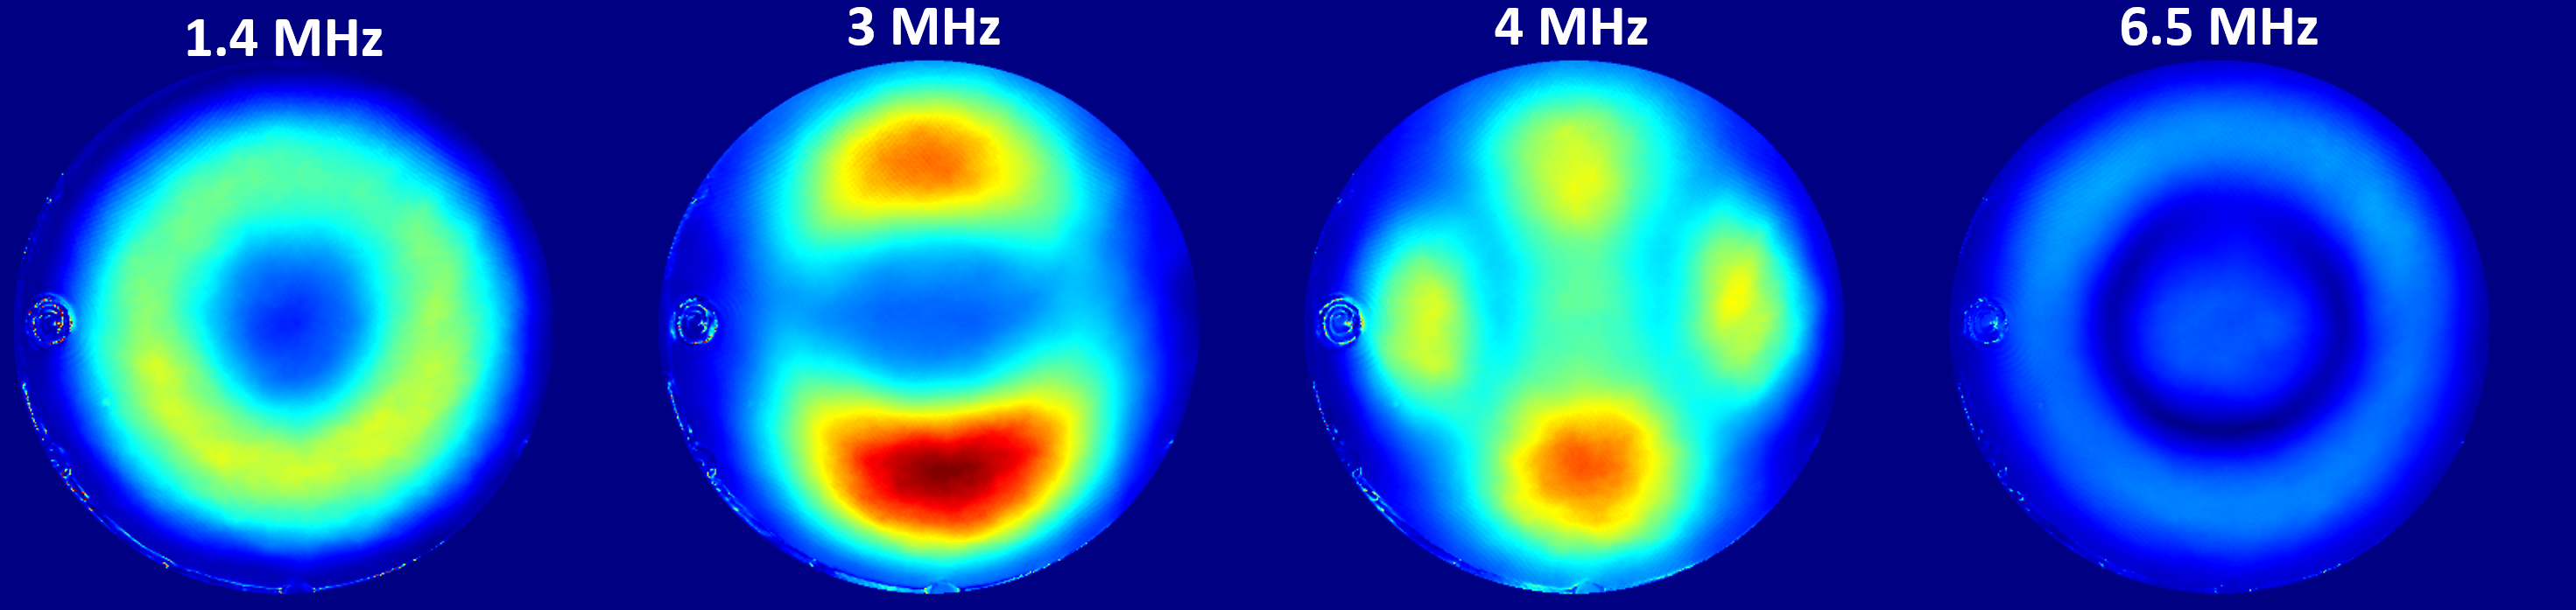
- Amplitude vibration maps, which give the amplitude response of the cMUT over the full measured field of view for each DFT frequency bin. Four of these are presented in Fig 5. Phase vibration maps can also be similarly calculated.
The Discrete Fourier Transform (DFT) of 3D time-sequences in the frequency domain generalizes the conventional single point frequency analysis into mega-pixel vibration amplitude maps calculated for each DFT bins/channels.
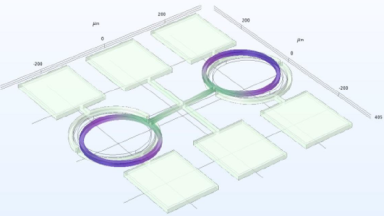
CMUT application description:
- Sample courtesy of: Philips
- System: DHM R2100
- Mode: Stroboscopic, burst excitation waveform: 2 sine periods at a frequency of 5 MHz repeated at 20 kHz.
- Environment: Liquid
Publications
“Characterization of cMUT by Dynamic Holography Microscopy,” 2009 IEEE International Ultrasonics Symposium, Rome, 2009, pp. 2205-2208, doi: 10.1109/ULTSYM.2009.5441729, N. Sénégond, et. al.
“3D topography time-sequence immersed measurement of MUT response to burst excitation” C. van Heesch et. al.. 14th International Workshop on Micromachined Ultrasonic Transducers MUT 2015